Arctic
The Arctic region supports globally significant populations of birds, mammals and fish. Continued rapid change in the Arctic will have global repercussions affecting the planet’s biodiversity as a whole. Therefore, understanding how the Arctic’s living resources, including its vertebrate species, are responding to these changes is essential in order to develop effective conservation and adaptation strategies.
Following an initial report in 2010, the updated Arctic Trend Index (ASTI) from 2011 tracks 890 populations of 323 species, representing 37% of all known vertebrate species found in the Arctic. Average abundance of Arctic vertebrates increased by around 20% between 1970 and 2007 (Figure 1), but trends differed for different ecozones. Low Arctic populations are faring best and increased in abundance, while high Arctic species are recovering after an initial decrease, with the sub Arctic showing the opposite trend (Figure 2).
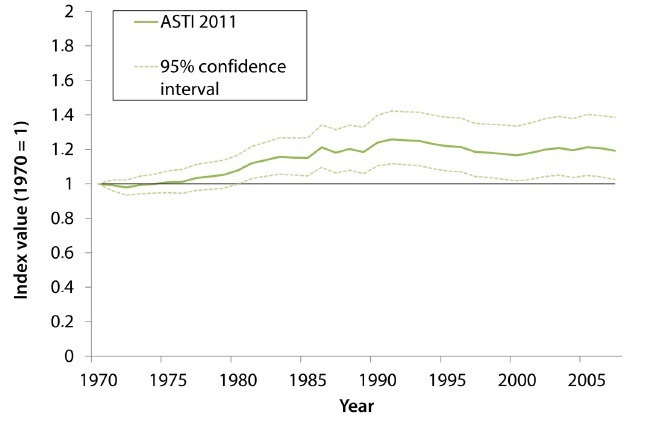
Figure 1. The Arctic Species Trend Index (ASTI) 1970-2007
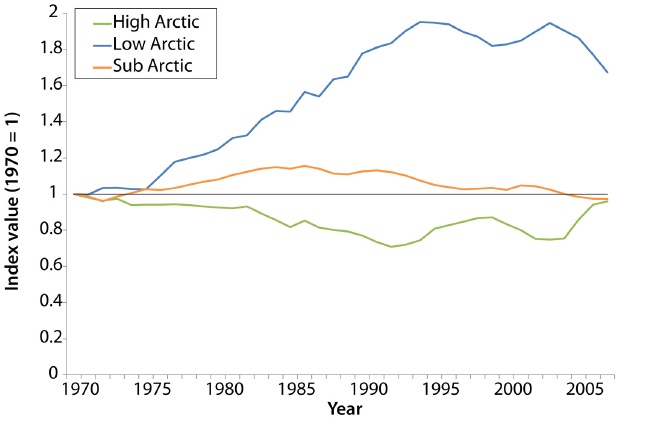
Figure 2. The Arctic Species Trend Index (ASTI) by ecozone 1970-2007
A closer examination of marine species revealed a similar pattern as the overall ASTI, with species populations increasing by around 20% between 1970 and 2005 (Figure 3). This can be explained by the strong influence of positive fish trends from the Pacific Ocean. While marine mammal abundance followed a similar trajectory (Figure 4), this apparent recovery is unlikely to have taken these species back to their historical highs. Marine birds exhibited the smallest increase over the study period, and it remains to be seen whether the levelling off in recent times represents the beginning of a decline.
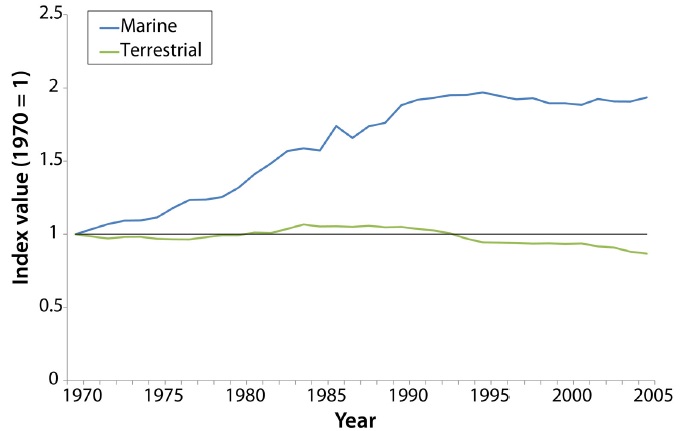
Figure 3. The marine ASTI for 1970-2005
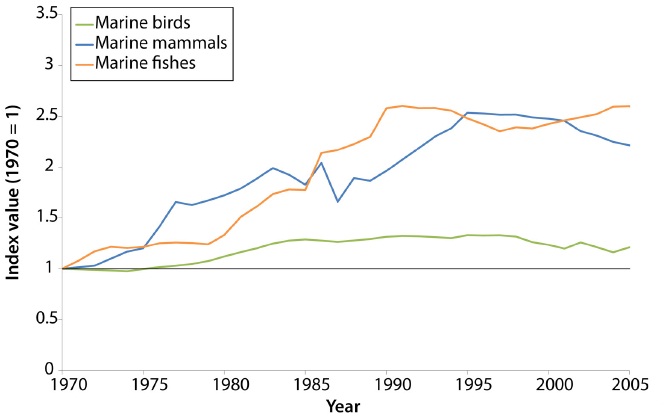
Figure 4. The marine ASTI by class 1970-2005
The three ocean regions Pacific, Atlantic, and Arctic, differed significantly in average marine population trends, with an overall decline in abundance in the Atlantic, a small increase in the Arctic and a dramatic increase in the Pacific (Figure 5). These differences again appear to be largely driven by variation in fish population abundance. In the Bering Sea, marine fish and mammals also increased, although there has been a decline since the 1980s in mammals, while marine birds have declined overall.
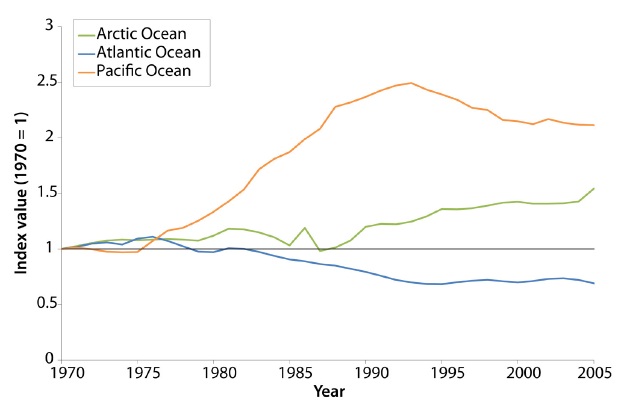
Figure 5. The marine ASTI by ocean 1970-2005
Interesting patterns also emerged for different functional groups. For example, pelagic fish abundance appears to cycle on a time frame of about 10 years, showing a strong association with a large-scale climate oscillation (Figure 6). There were mixed trends among sea ice associated species, with just over half showing an overall decline
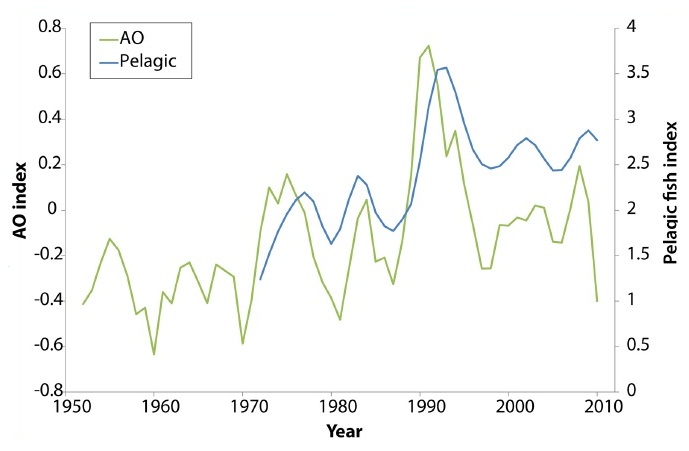
Figure 6. Pelagic fish abundance is associated with a large-scale climate oscillation 1970-2010
Data coverage was extremely variable across space, with long time-series concentrated around the Bering Sea, Iceland and northern Scandinavia, and noticeable gaps in Russia (Figure 7). Further analysis revealed clusters of population decline for fish, and some birds and mammals, in the Labrador Sea, and for caribou, lemmings and shorebirds on the Queen Elizabeth Islands. In addition, the proportion of locations with increasing or stable populations was found to have declined over time. This could reflect a change in the nature of the monitoring programs themselves – for example a shift in focus from monitoring abundant, utilised species for management purposes to also looking at declining species for conservation in recent decades. A preliminary analysis of potential drivers of trends accounted for only a modest amount of the observed variation, and a better suite of predictor variables is needed for future research.
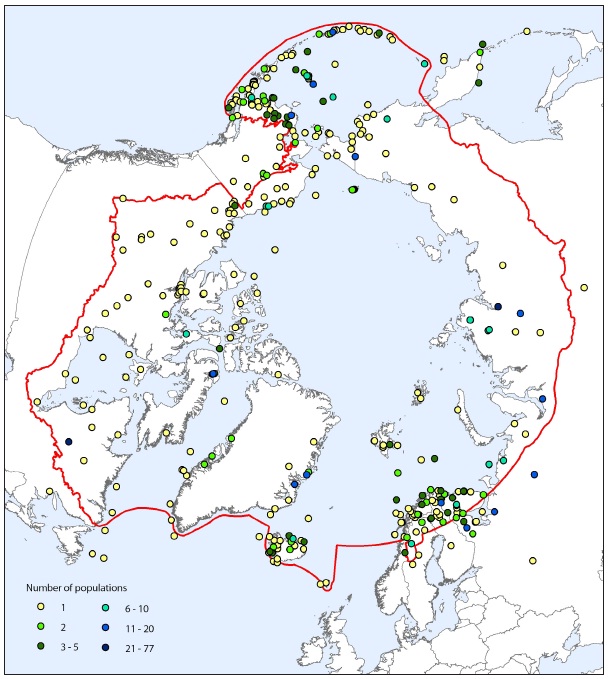
Figure 7. Distribution of population time-series data across the Arctic region 1951-2010 and CAFF (The Conservation of Arctic Flora and Fauna) boundary. Please note: Number of populations per locations are indicated by colour.
If you would like to read the full reports:
Marine report (1.60 MB) Spatial report (4.96 MB) Key findings report (5.30 MB)
Collaborators
The Arctic Species Trend Index was commissioned by the Arctic Council’s CAFF Circumpolar Biodiversity Monitoring Program (CBMP). The development of the index was a collaboration between the CBMP, the Zoological Society of London, UNEP World Conservation Monitoring Centre and the Worldwide Fund for Nature. Further information available from Arctic Species Trend Index (ASTI).


