Migratory Species
The LPI methods for aggregating population trend information have been applied to species listed under the Convention on Migratory Species (CMS) and Global Register of Migratory Species (GROMS). Migratory species threatened with extinction are listed on Appendix I of the Convention, migratory species that need or would significantly benefit from international co-operation are listed in Appendix II of the Convention, while GROMS lists all known migratory species regardless of their status.
 Analyses revealed that migratory species have overall increased in global abundance between 1970 and 2006. The pattern of increase in CMS-listed species abundance exhibited in Figure 1 may illustrate the success of the convention since its entry into force in 1979, and suggests that species covered by the convention are faring better than other migratory species. However, while these three indices reveal the average trends in CMS and migratory species globally, disaggregating the data reveals details that are not apparent from such broad scale analyses.
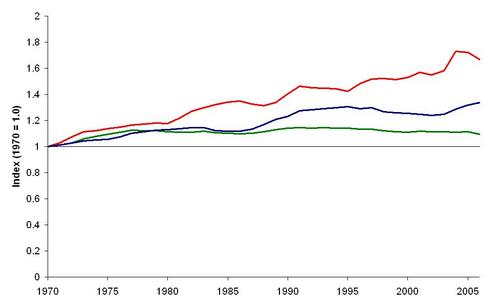 Figure 1. Global Living Planet Indices of CMS Appendix 1 listed species (red line), all CMS listed species (blue line), and all migratory species (green line) for the period 1970-2006
 By plotting data for birds, mammals and fish separately, the difference in trend trajectory between the three groups becomes apparent (Figure 2). The CMS bird index mirrors the trend of the global CMS index (figure 1) as birds dominate the overall dataset, and shows an overall increase in species abundance between 1970 and 2006 of about 40%. The CMS fish species index however shows a steep decline in abundance since the mid 1980s. The CMS mammal species index, while indicating an overall increase in species abundance of 30% between 1970 and 2006, shows a decrease in abundance over the last ten years and no net change over the 15 years before that.
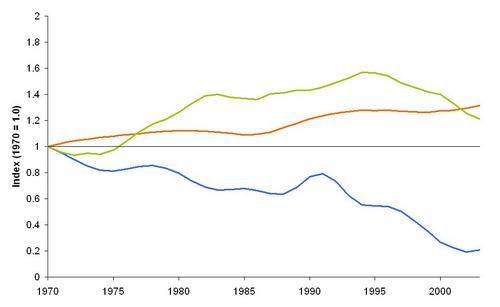
Figure 2. Index of all CMS-listed birds (orange line), mammals (green line) and fish (blue line) for the period 1970-2003. All three indices are presented with a 3 year running average
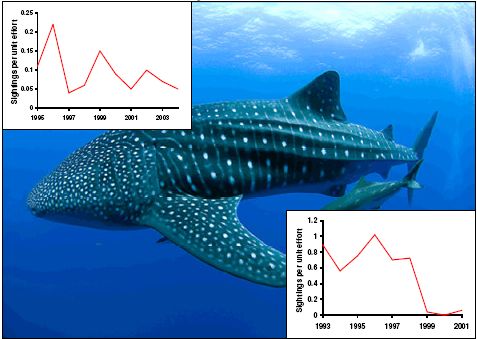
Figure 3. Two population time series for the Whale shark (Rhincodon typus) from different locations in the Indian Ocean. Many chondrichthyan fishes are under threat from overfishing (both directly and through bycatch), pollution and habitat destruction. Slow growth, late maturity and low fecundity are common intrinsic factors that reduce this group’s resistance to these threats
See the full report below
The Living Planet Index for Migratory Species (0.85 MB)
Collaborators
This report was commissioned by CMS in collaboration with ZSL and WWF. The results were presented at the 15th Scientific Council Meeting in Rome, Italy November 2008.


