Living Planet Index
Status and Trends of the Earth’s Protected Areas
Protected areas (PAs) have been heralded as one of the cornerstones of global conservation efforts. PAs currently cover 15.4% of the world’s terrestrial areas and 8.4% of the world’s ocean area. Although coverage is increasing there is growing evidence that protected areas are not always effective. For conservation strategies to be successful it is therefore critical to find out if, where and how PAs are working.

Figure 1. The geographical location of populations within the Living Planet Database. Larger circles indicate locations with multiple populations.
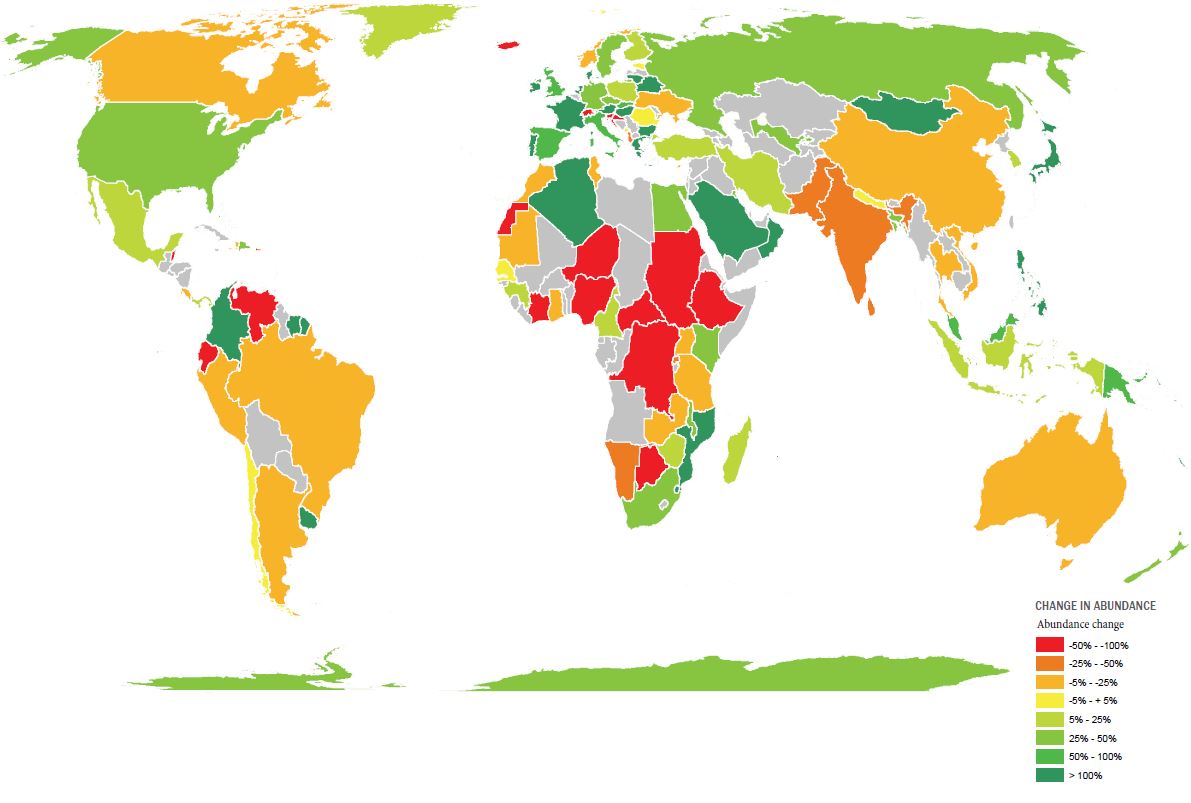
Figure 2. Map showing the change in abundace of wildlife populations within protected areas.
Population trends within PAs vary greatly across countries with average trends ranging from pronounced increases to rapid declines (Figure 2). Of the 130 monitored countries, 39% show declining wildlife populations within protected areas.
.")
Figure 3. Living Planet Index showing trends in high, medium and low income countries 1970-2010 (World Bank, 2014)
Some of these differences relate to differences in income and perceived corruption across countries. For example, comparing population trends in countries with differing levels of household incomes shows that populations inside PAs located in high income countries are increasing (average 62% increase since 1970), relatively stable in middle income countries (average 22% increase), but have declined by 27% in low income countries (Figure 3).

Figure 4. Living Planet Index showing trends in taxonomic classes from 1970-2010. Reptiles and Amphibians have been combined as 'Herpetofauna'.
Taxonomy also plays a role in the differences in trends in wildlife populations within protected areas (Figure 4). Reptiles and amphibians in PAs show average population declines of 34% and 97% respectively (combined a decline of 74%), while fish, birds and mammals showed increasing trends (182%, 57% and 10% respectively).

Figure 5. Primary threats recorded for populations within protected areas.
Although these results suggests that PAs are working in some cases, protected wildlife populations continue to be affected by habitat change and exploitation (Figure 5), including in some of the most famous PAs in the world, for example in Australia’s Great Barrier Reef and the US Everglades.
Following this introductory report, it is crucial that we move beyond describing trends and start understanding the processes that enable some PAs to be effective and others not. As a growing collaborative effort we will continue to work on this important dimension of PA research and policy, addressing the issues and opportunities presented in this report and building a robust tool for measuring biodiversity outcomes in protected areas.
Read the full report below:
Protecting species 2014 (10.4 MB)