Database Statistics
- Database growth over time |
- Number of populations and species |
- Time-series length |
- Temporal distribution of data |
- Data sources |
- Geographical distribution? |
- Current data gaps
The following provides an overview of the content of the Living Planet Database (LPD) as of 20th April 2022. If you think you have or know of any data which could be added to the LPD, please get in touch with us using our contact or contribute pages
Database growth over time
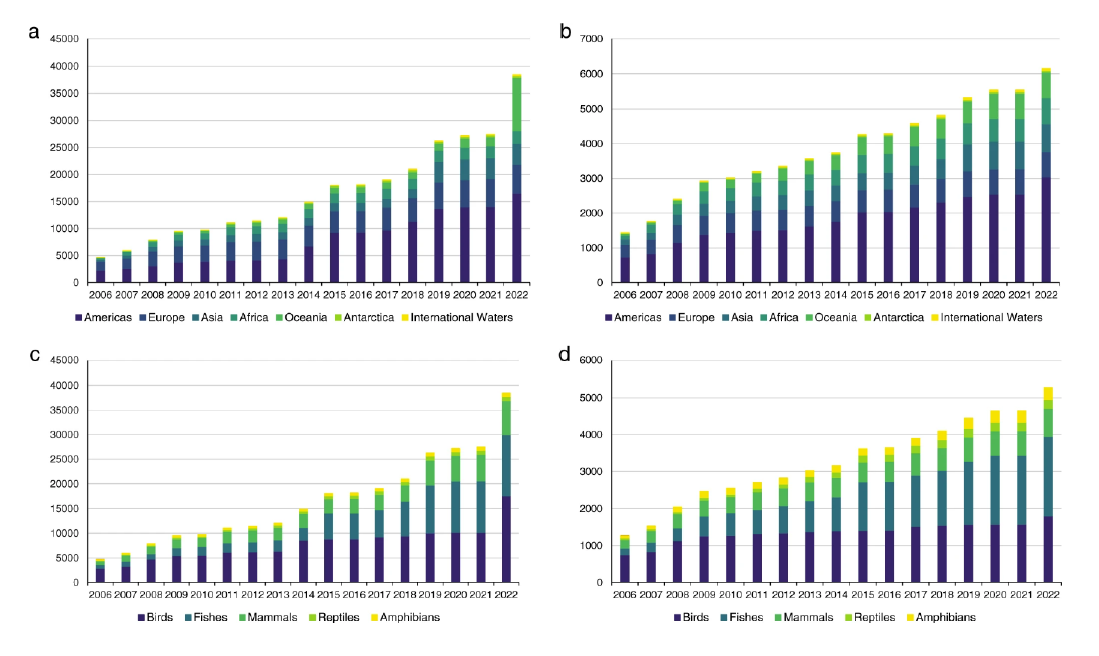
Figure 1 Growth in number of populations and species in the Living Planet Database (LPD) by region and taxa. The cumulative number of new a) populations and b) species entered by region, and the cumulative number of c) populations and d) species entered by taxon. Please note 2b adds up to more than the individual number of species as some species occur in more than one region. From Ledger et al. (2023).
Since the online database was established the time and date of entry are saved with the record, enabling us to track how many populations and species are being added over time. There are now over 5,500 species and almost 42,000 populations in the database. The relatively steady increase over time has been punctuated by a few steep increases in records which coincide with the completion of certain reports and projects.
Number of species and populations by class
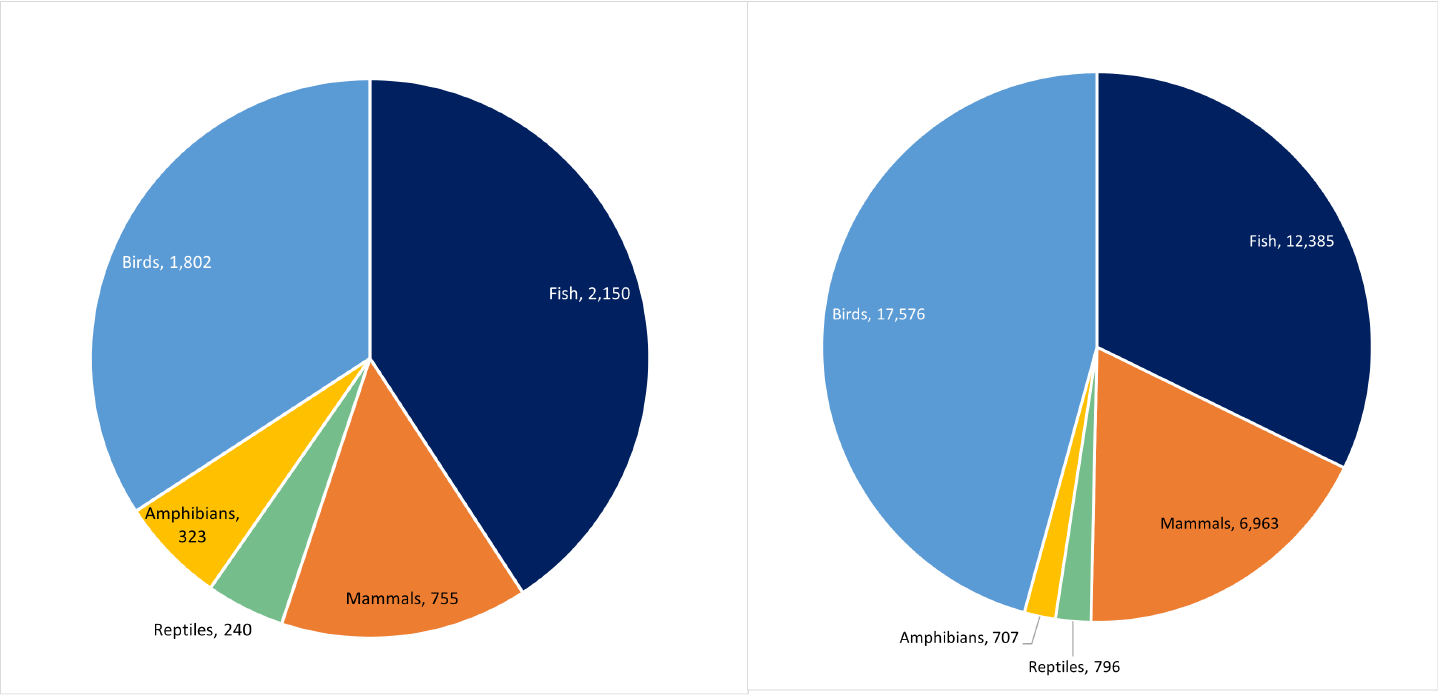
Figure 2 Pie charts showing the number of a) species and b) populations in the Living Planet Database by class.
Fish are the dominant class in the database [1], contributing the majority of species and almost half of populations (Figure 2). Birds form a similar portion of the species in the database.

Figure 3 Graph showing the number of species in the Living Planet Database (solid bars) as a subset of the total number of species in the class based on figures from the relevant taxonomic authorities (hollow bars).
Looking at the representation of classes in the LPI in more detail, Figure 3 shows how the number of species in the database compares to the total estimated number of species in the world. Birds once again have the highest representation of any class, followed by mammals, fish, amphibians and reptiles, the latter having the lowest representation (Figure 3). Birds are the best-studied class so one reason for the high representation achieved is that there are many publications about different bird species.
[1] Fish aren’t technically one class but a group comprising the following classes. Actinoptergyii, Cephalaspidomorphi, Myxini, Sarcopterygii, Elasmobranchii and Holocephali (with the latter two sometimes joined as Chondrichthyes). These different classes are combined for ease of interpretation.
Number of species by system
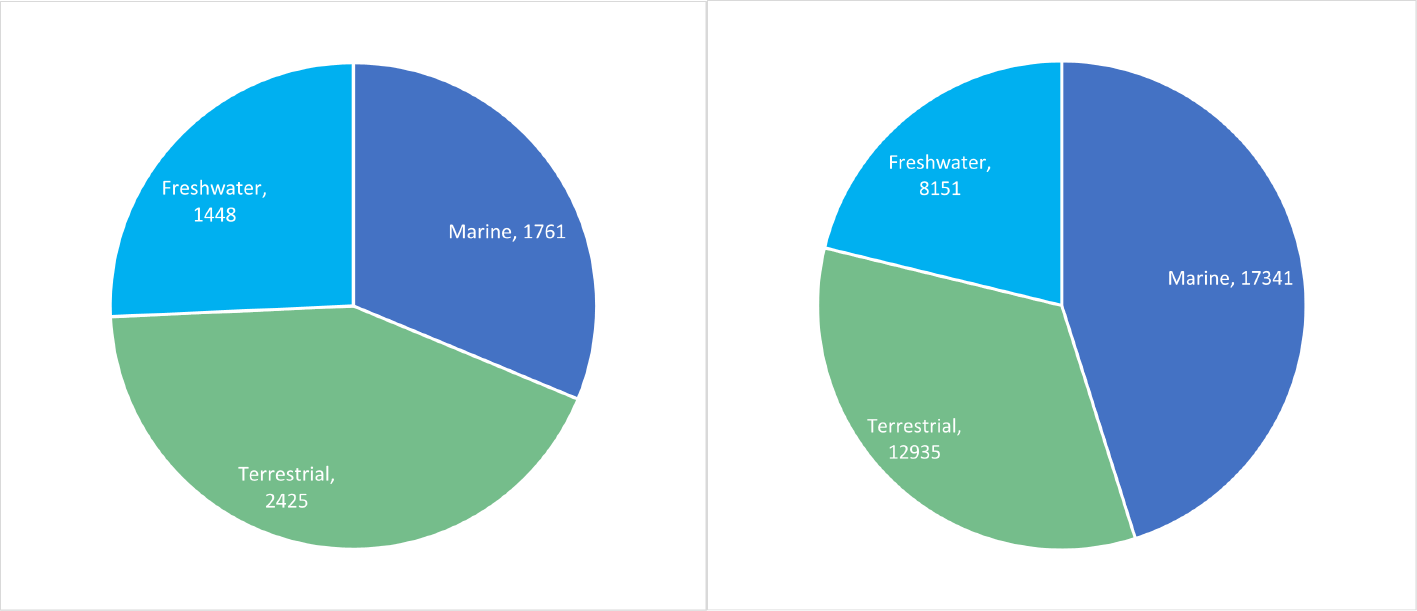
Figure 4 Pie charts showing the distribution of a) species and b) populations in the Living Planet Database across the terrestrial, marine and freshwater system.
Terrestrial species form the bulk of records in the LPI, though at the population level there is a greater number of marine populations than terrestrial (Figure 4). Considering that freshwater systems cover a substantially smaller portion of the world’s surface, it is not surprising that fewer species and populations from that system are contained in the LPI.
Time-series length
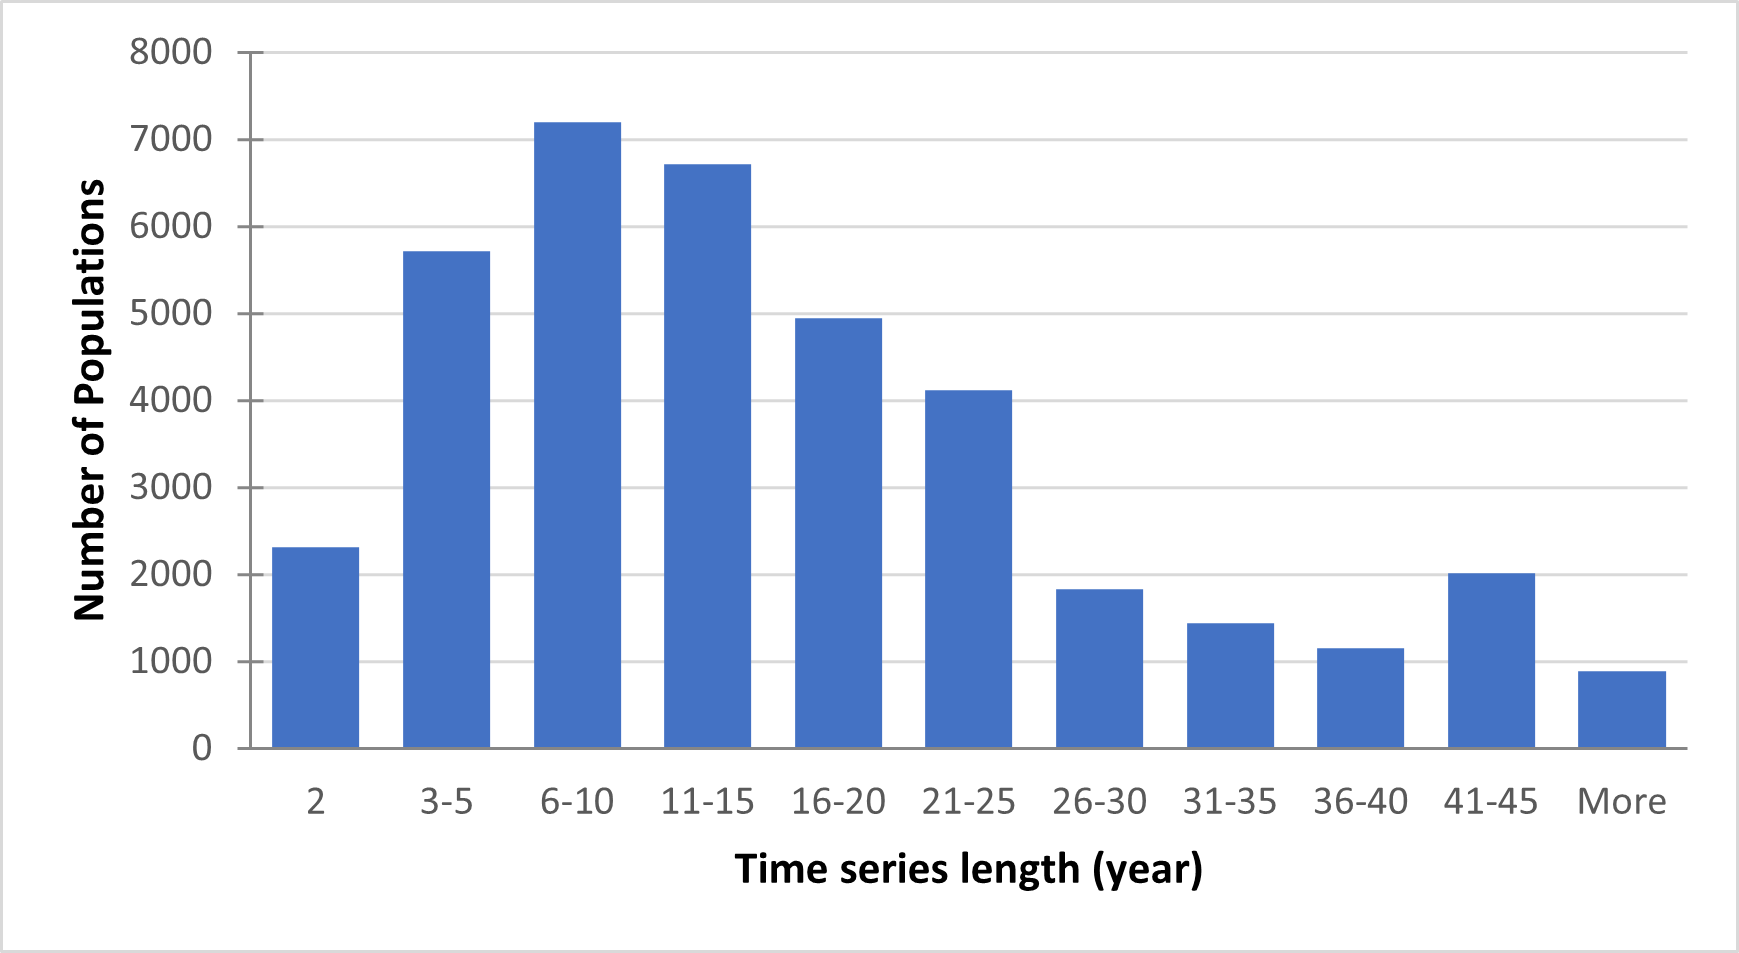
Figure 5 Bar chart showing the distribution of populations according to their length.
The majority of records cover 6-10 years of population data (Figure 5). There are over 2,000 records with the minimum amount of population data, 2 years. There is an unusual jump, in an otherwise decreasing trend in the number of populations with longer time series, with many records running from 1970 to 2011-2015.This is likely due to the large proportion of time-series stemming from long-term monitoring programmes such as the North American Breeding Bird Survey.
Temporal distribution of data
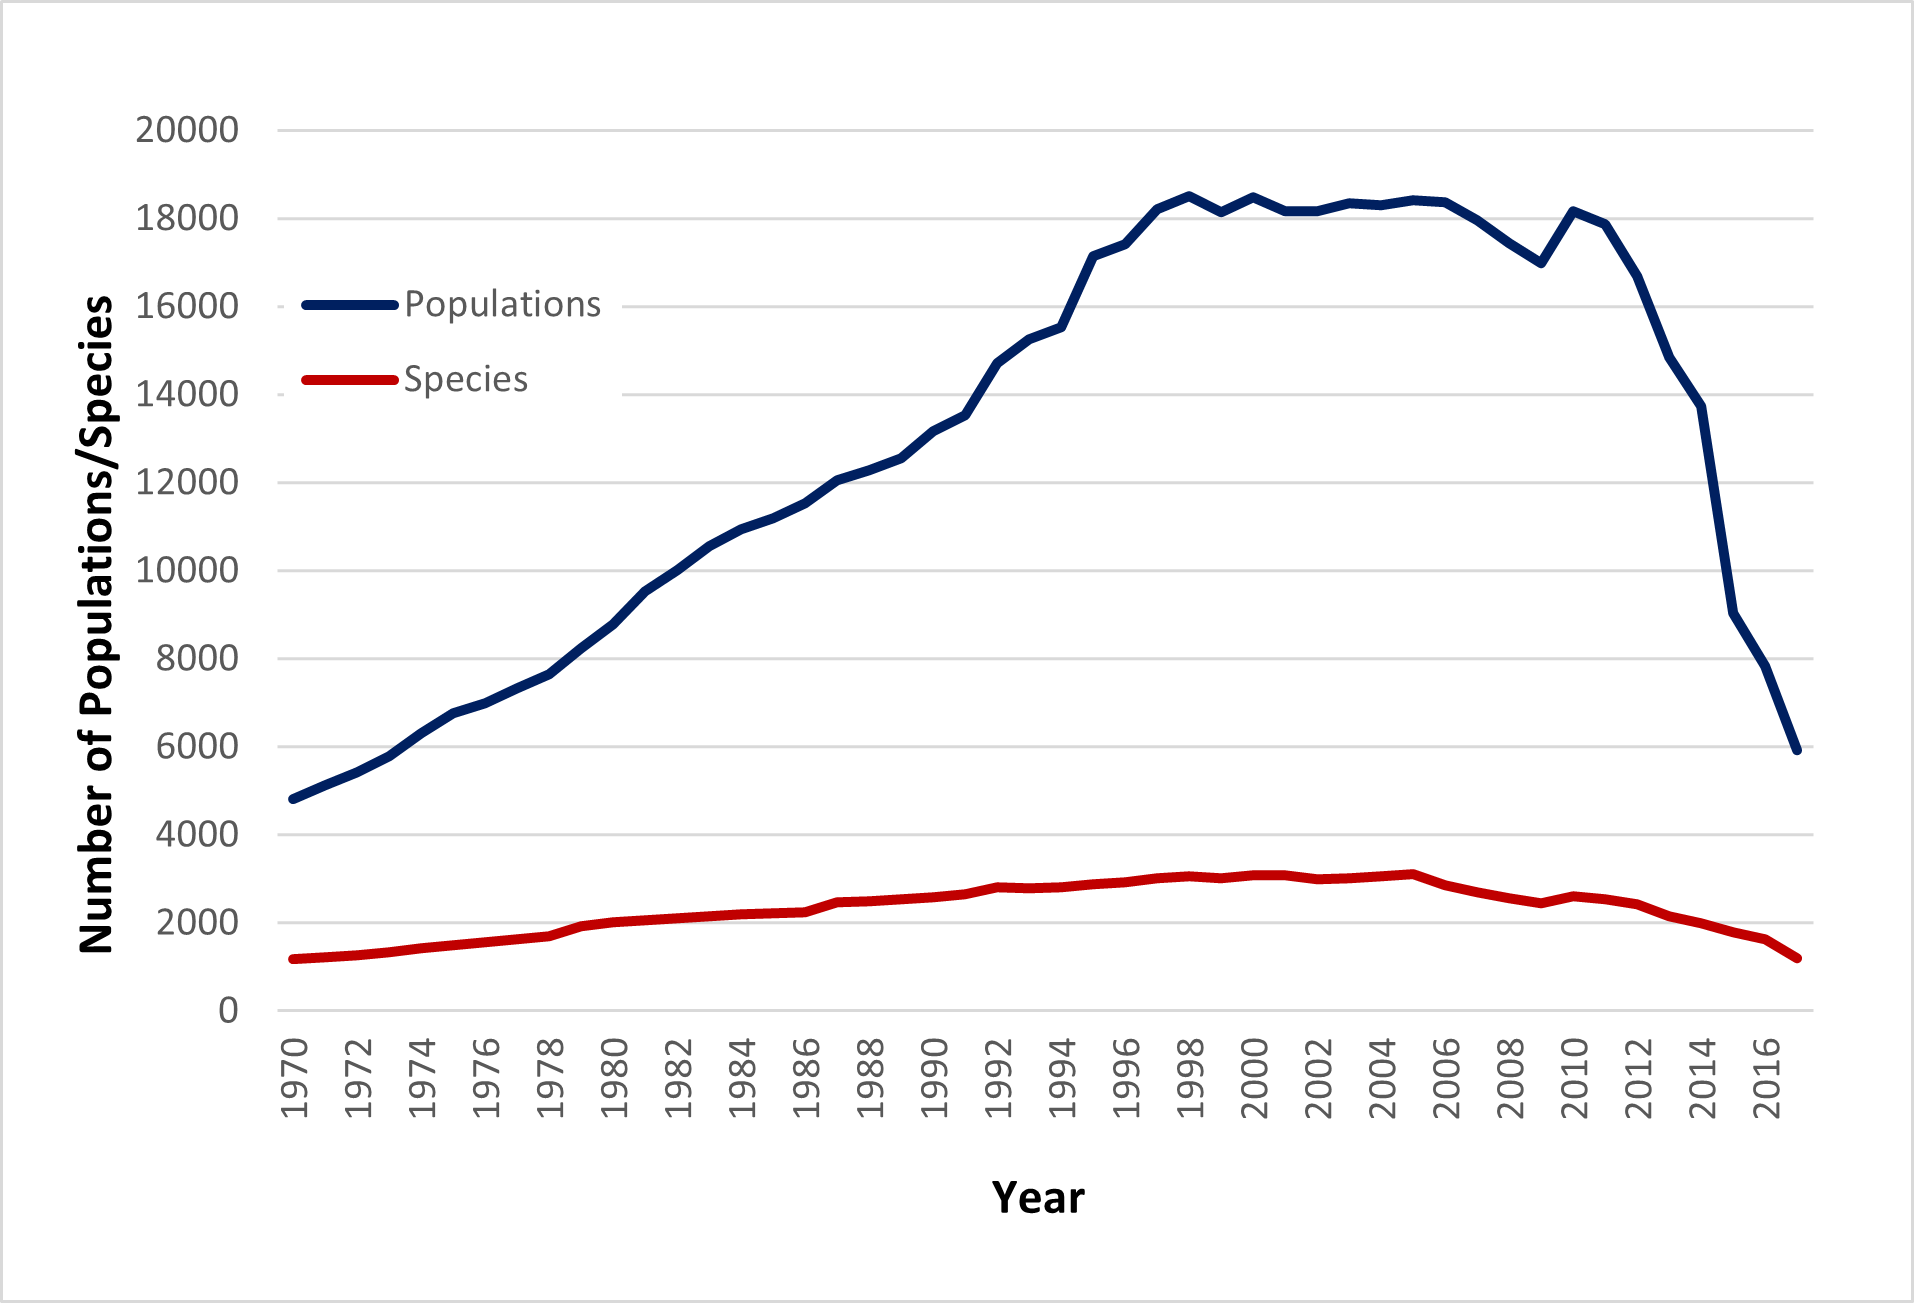
Figure 6 The number of populations and species which have a data point in a given year.
The number of populations and species which have a data point in a given year rises steadily from 1970, reaching a peak of >18,000 and > 3,100 – respectively - in the late 1990s and early 2000s. After this point, numbers drop rapidly. As research on wildlife population change is still ongoing in more recent years, this reduction in the number of contributing populations and species is mainly due to a lag in the publication of collected data. In addition, data are published at such a rate so as to create a backlog of time-series to be entered into the database, and newer data sources are unlikely to be added unless they are in line with the current focus of data collection.
Data sources
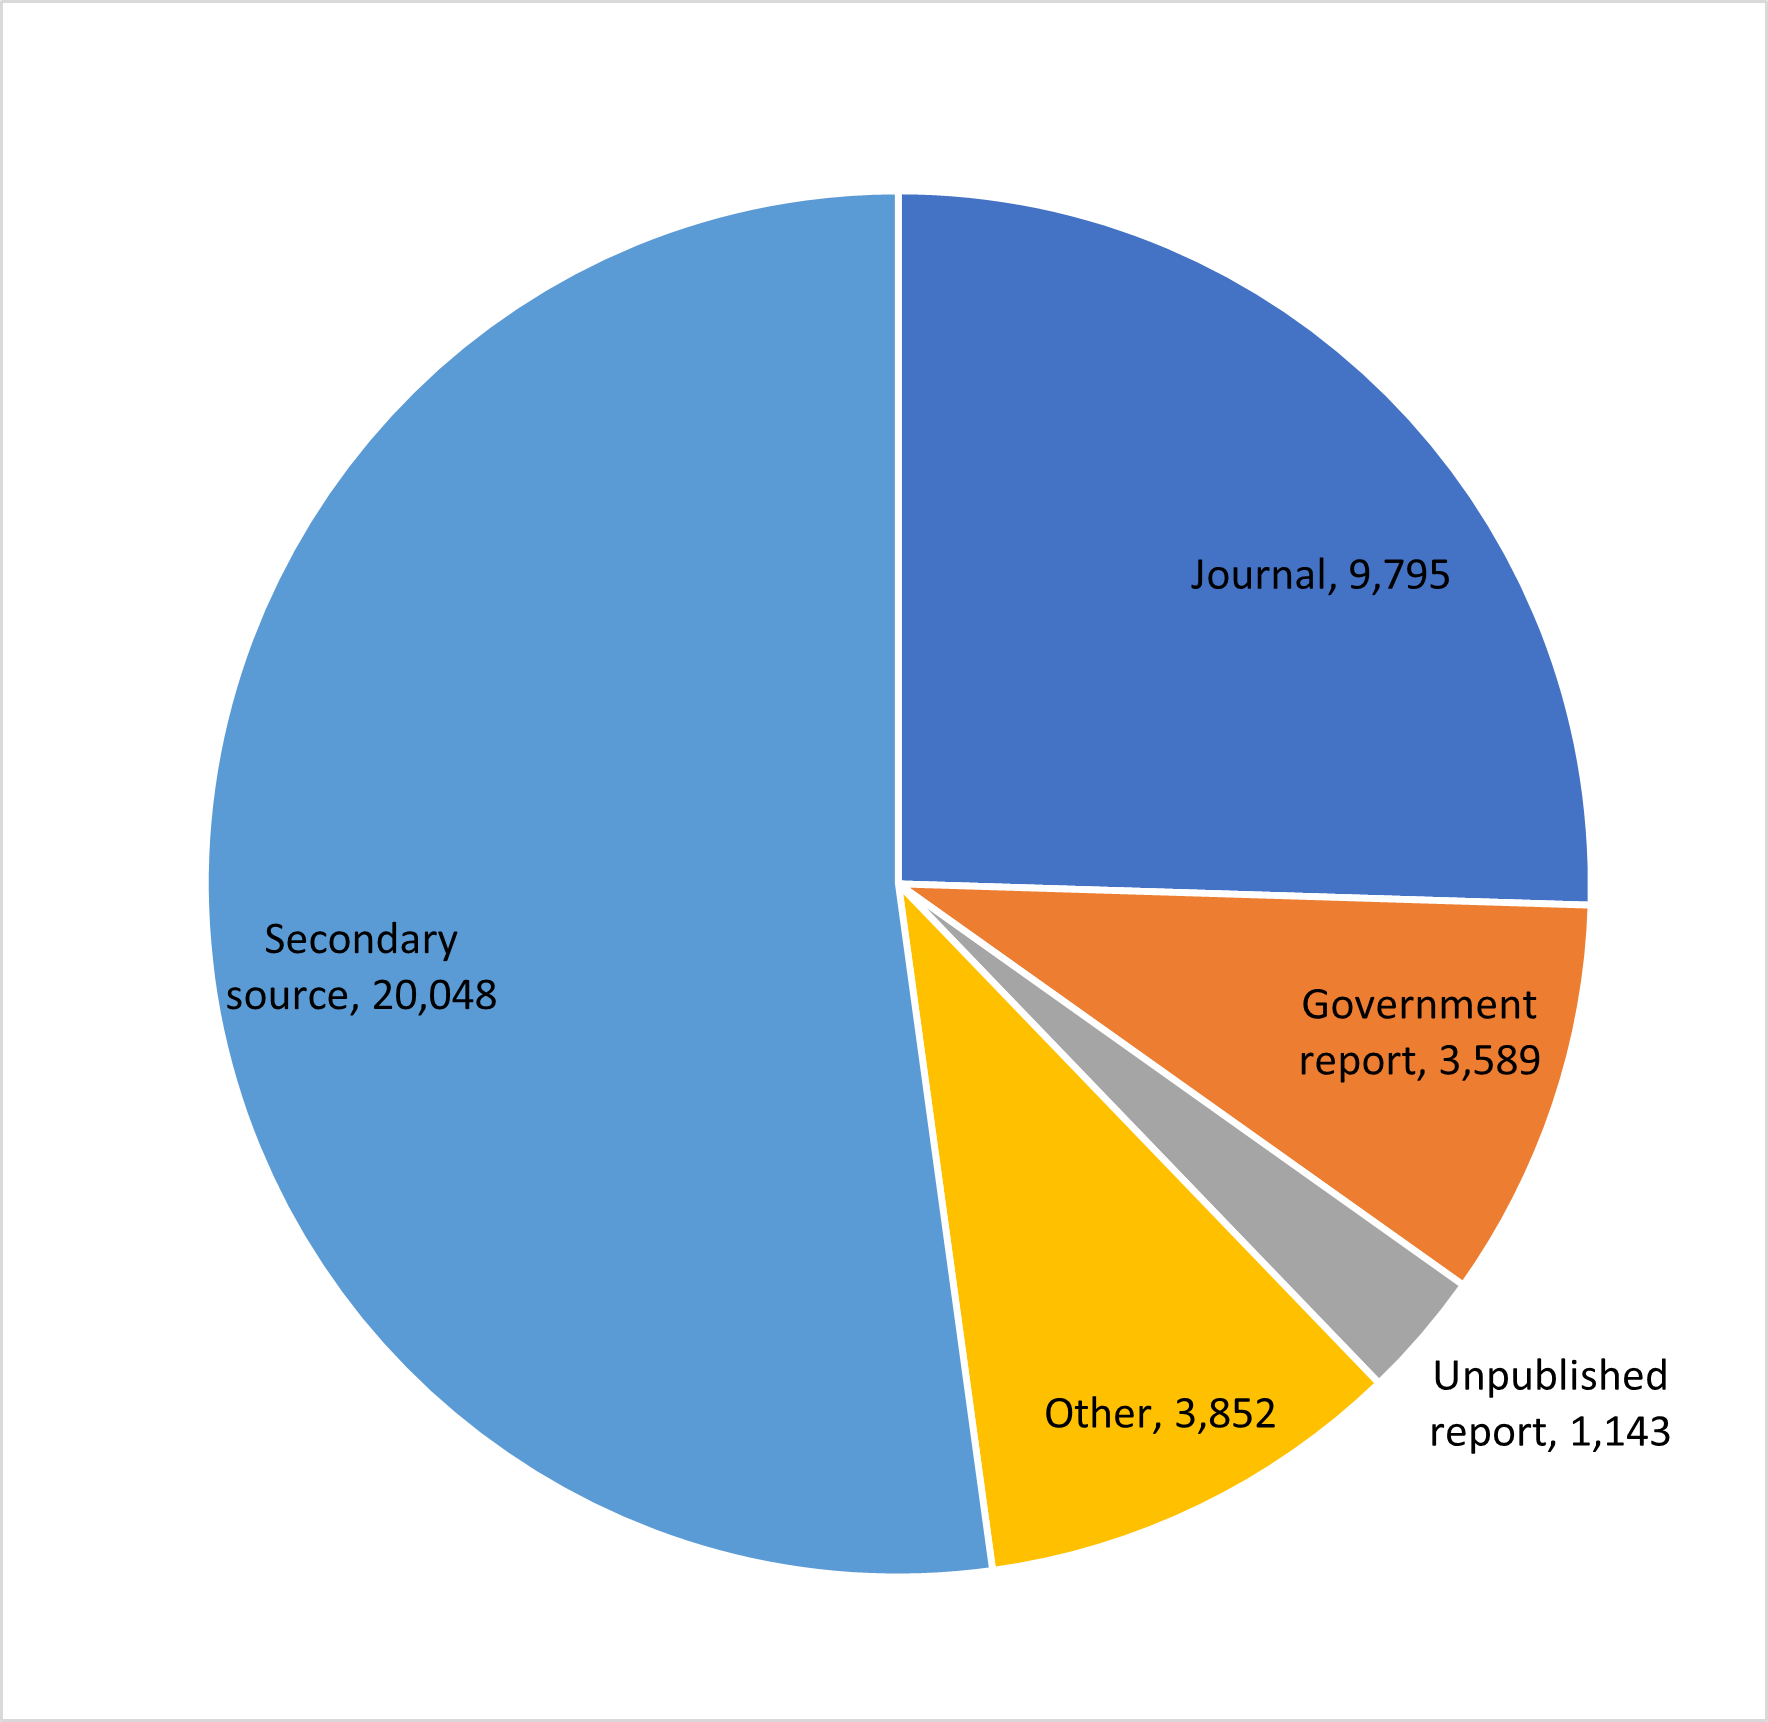
Figure 7 Pie chart showing the distribution of population sources in the database.
The majority of population records were sourced from secondary sources, which are articles or reports that use population information from another typically referenced source (Figure 7). Peer-reviewed journals are the second most common data source. Other sources include expert judgements, other unspecified sources and population records from an unknown source.
Geographical distibution
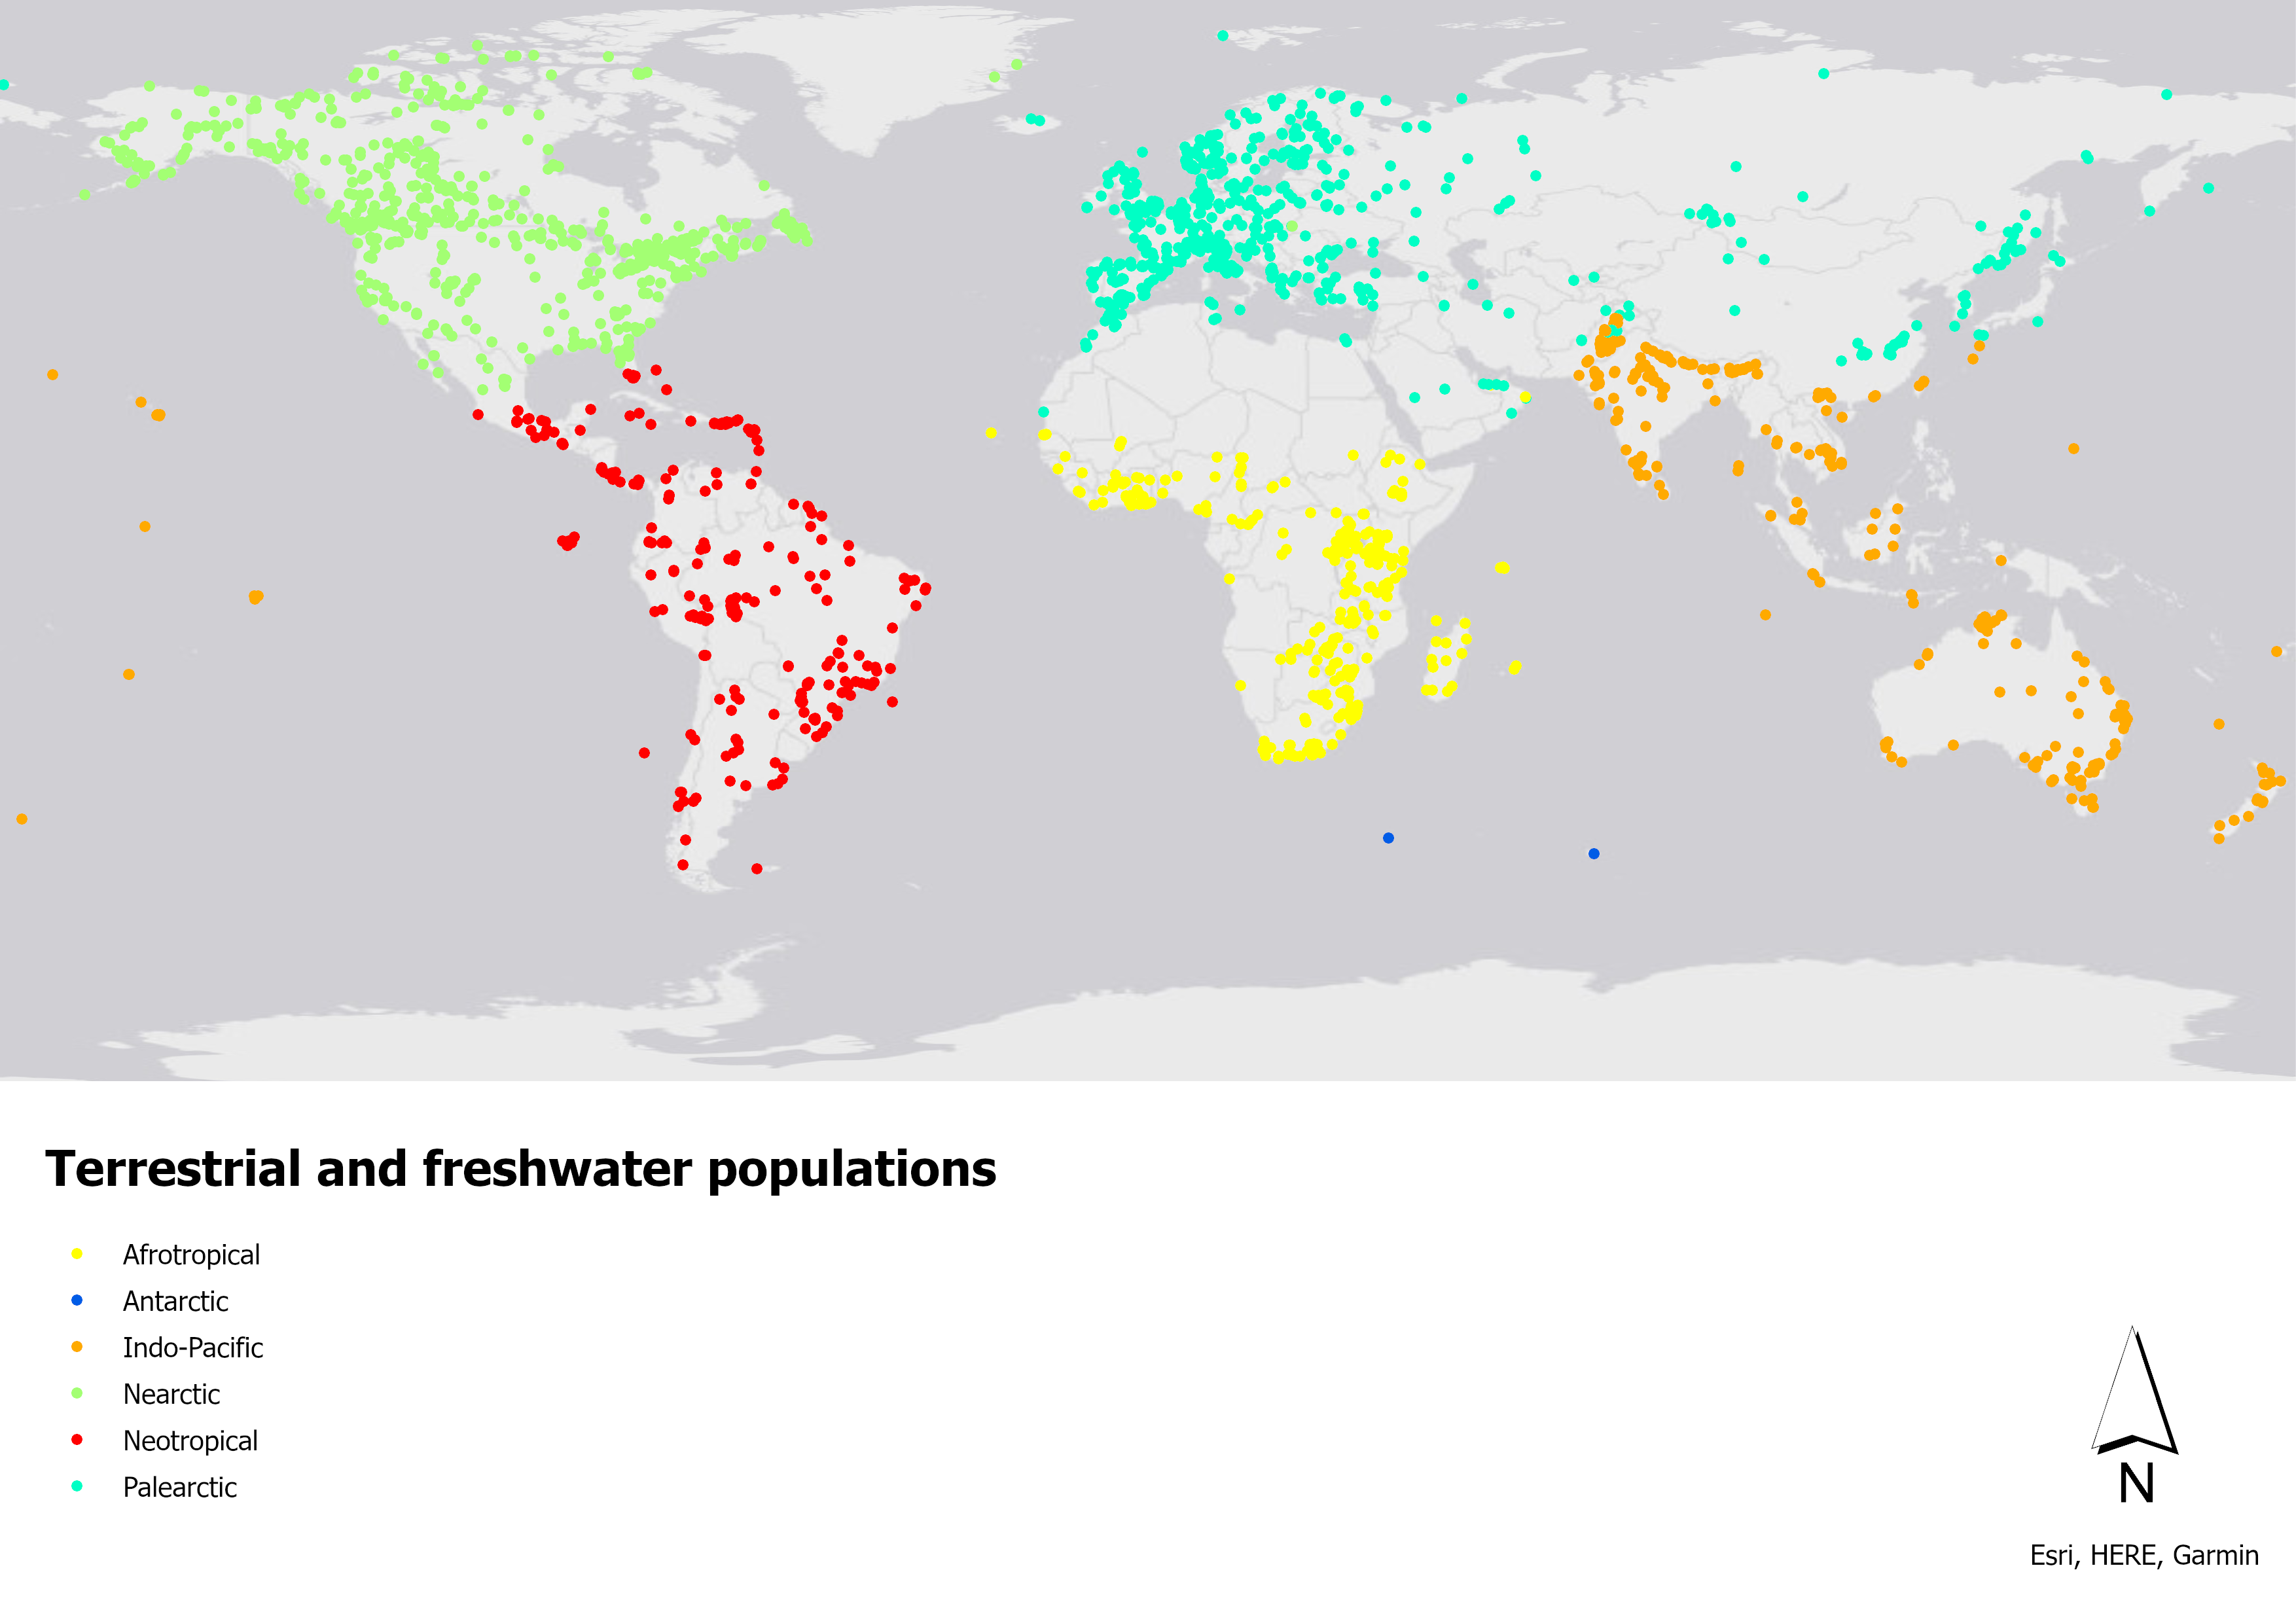
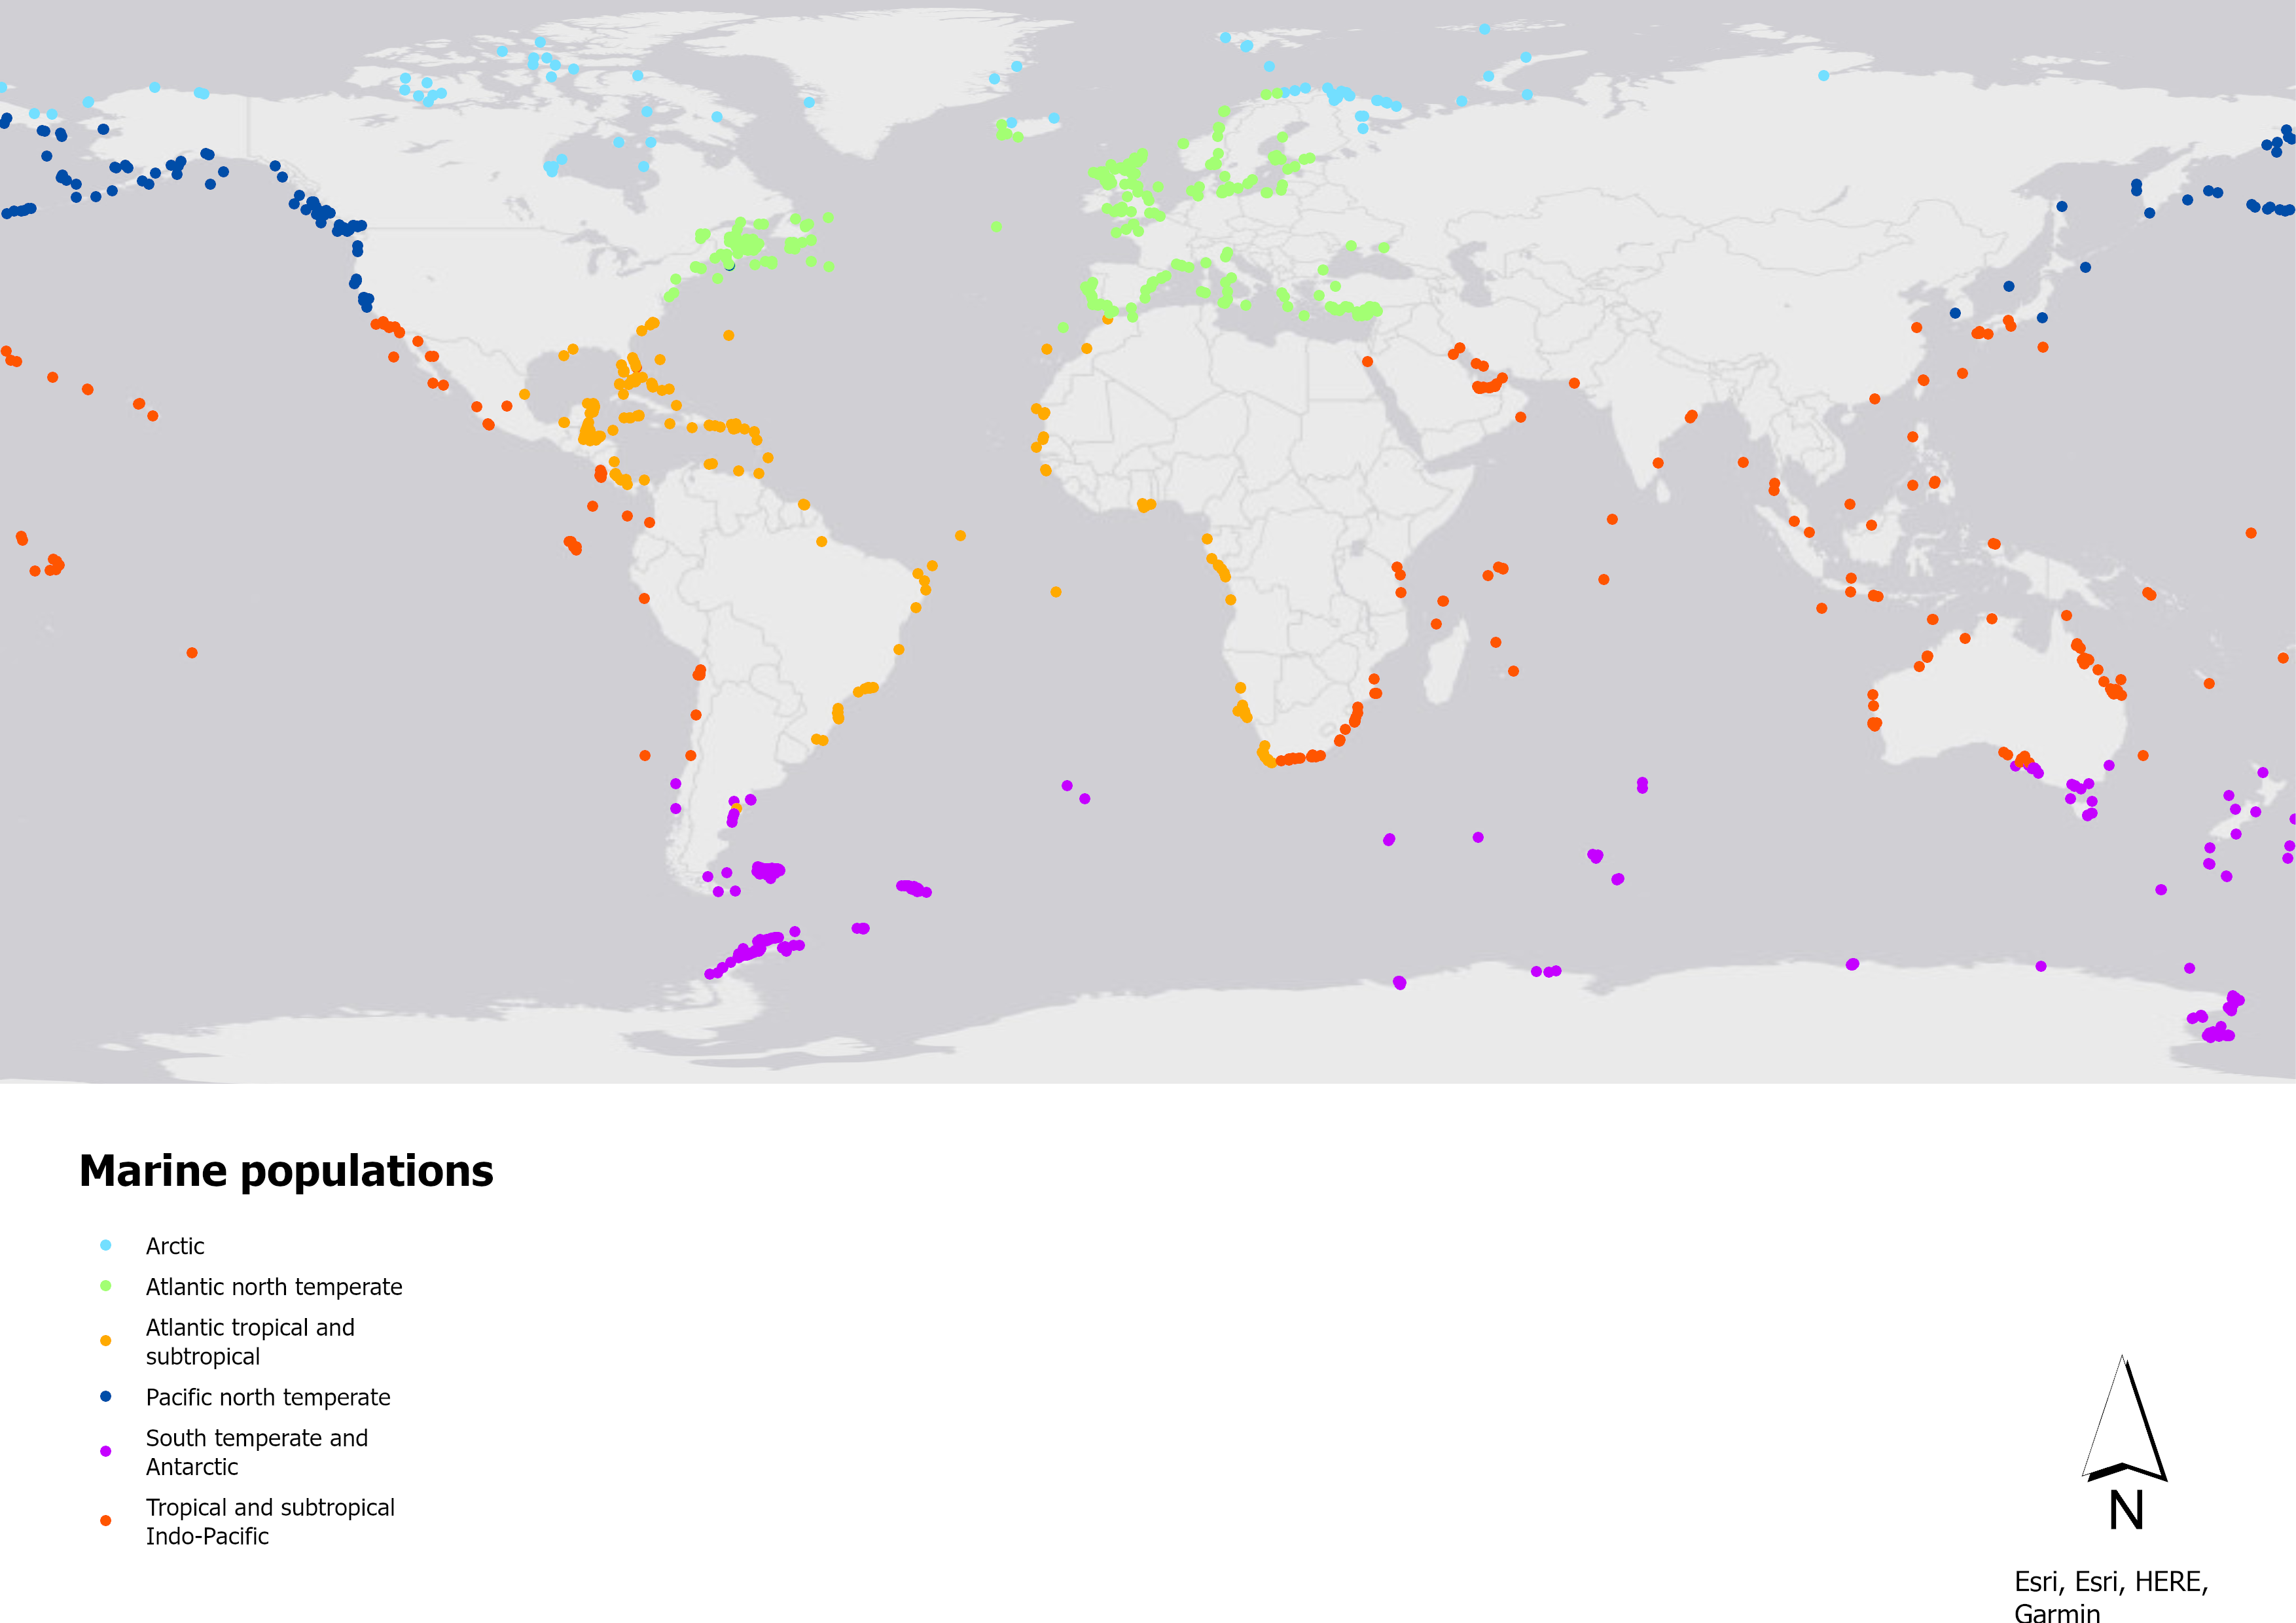
Figure 8 Map of terrestrial & freshwater (top), and marine populations (bottom) in the Living Planet Database. Only populations monitored in a specific location are plotted on the map.
There is an unequal spatial distribution of populations in the LPI. For terrestrial systems, more populations come from North America than anywhere else, closely followed by Asia, Oceania and Europe, whilst for freshwater systems, more populations come from Latin America and the Caribbean, followed by North America and Europe. For marine systems, most populations come from Oceania, followed by North America and Latin America and the Caribbean(Figure 8). The figures also highlight the large gaps in distribution for both terrestrial and freshwater, and for marine populations.
Current data gaps
The records which are currently contained in the LPD have been added opportunistically using published data, with data entry often following the focus of projects in progress. There is also a bias in available data from particular regions and species groups and from publications in the English language. If we compare the number of species currently represented in the LPD with the number of known vertebrate species globally, we can identify gaps in coverage. This provides an opportunity to target data entry towards these taxonomic and geographic gaps. Table 1 and 2 present the biggest data gaps in the LPD split into systems, classes and biogeographic realms. Overall, fish are the most underrepresented group in the database, followed by reptiles. If you think you have data which could be used to address these gaps, please get in touch via our contribute or contact pages or email us at livingplanetindex@ioz.ac.uk.
Table 1 The top 5 least well represented group/realm combinations in the Living Planet Database for terrestrial and freshwater systems.
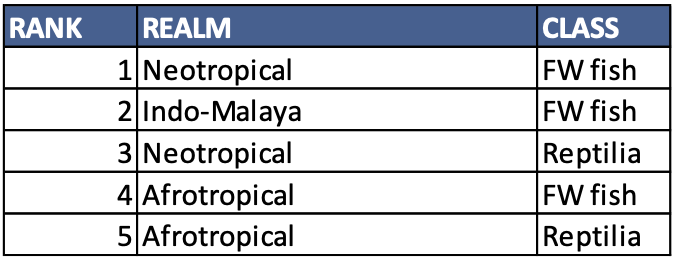
Table 2 The top 4 least well represented group/realm combinations in the Living Planet Database for the marine system.


